


Each December, WineGlass Marketing releases email benchmarks for the wine industry. We do this because having a bar to evaluate email performance has always been a challenge within the wine ecosystem.
Benchmarks are widely available for broad categories such as “Retail” or “Food and Grocery,” but finding something to compare a Wine Club email to is historically as accurate as predicting what would happen next in 2020.
2020 will forever have an asterisk next to it, noting numerous external forces outside of our control which affected our marketing and response rates. When looking at the calendar, there are many force majeure events worth noticing that likely prevented our customers from responding typically:
• We had an initial Shelter-in-Place order closing tasting rooms and restaurants in mid-March. The government asked us to work at home and limit our time outside, so eCommerce delivery options filled the void. Our media consumption changed as we searched for connections, and we became glued to CNN and obsessed with Facebook, YouTube, and TikTok. Business suffered, and by the end of Spring, our unemployment rate was in the double digits.
• Tensions rose with the temperatures as several racial injustices made headline news culminating in the death of George Floyd on May 25. This horrible tragedy unleashed weeks of riots and demonstrations throughout the summer months. Some states relaxed their grip on the Shelter-In-Place orders, albeit cautiously, which resulted in a flurry of changing rules. Forced to interpret the rules, wineries tried to convince customers to visit again.
• And then came the fires. Not one but two waves in August and September devastated western states, including California. The fires destroyed a few wineries but caused extensive smoke taint damage to the 2020 vintage for a larger group. The media descended, and reporters were everywhere convincing consumers to stay away from a Northern California that was in flames, leaving wineries the practical duty of reporting the actual impact to their mailing lists.
• The fire of different views on how to handle the virus and inequality in our country was fanned brighter in the fall with a very contentious national election. September and October saw media ads and email boxes jammed packed, so there was very little else on anyone’s mind.
• Finally, in Q4, there was no letting up with another wave of Coronavirus underway with several states considering going back to strict stay-at-home guidelines. Some expect the most significant online holiday shopping season yet, but that will uncover itself in time.
Throughout all of this year, our customers have endured. They have accepted their club shipments and opened our emails, and God bless them, they have ordered wine.
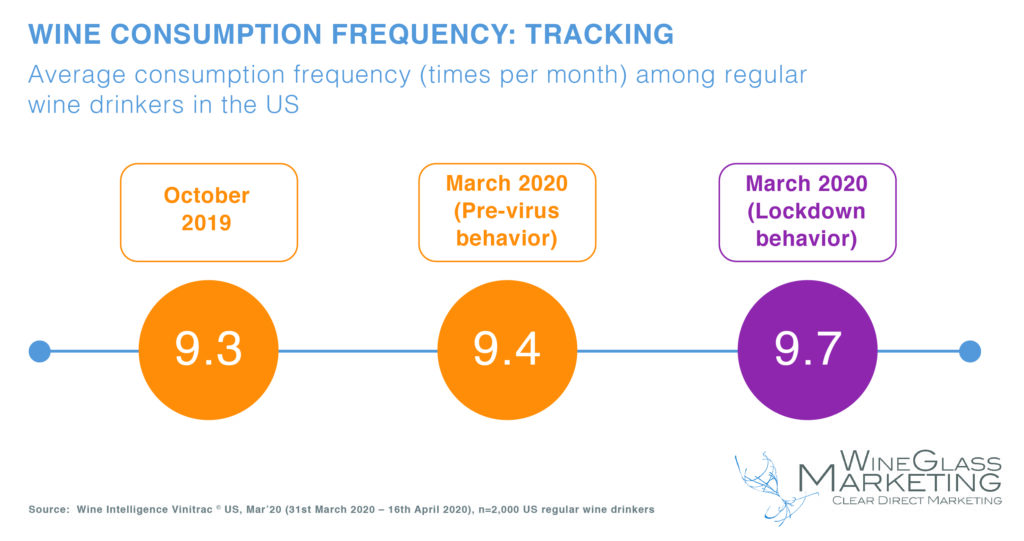
A lot of wine, actually. Early in the year, Wine Intelligence reported initial growth in wine consumption frequency due to the shift to at-home occasions more than compensated for the loss of on-premise occasions. Thus, making our emails more critical than ever.
However, did this trend continue? Hubspot says no. The marketing juggernaut released a report at the end of October this year asserting that after initial explosions of emails and subsequent consumer mass consumption, the responses to emails, and sales, are dwindling.
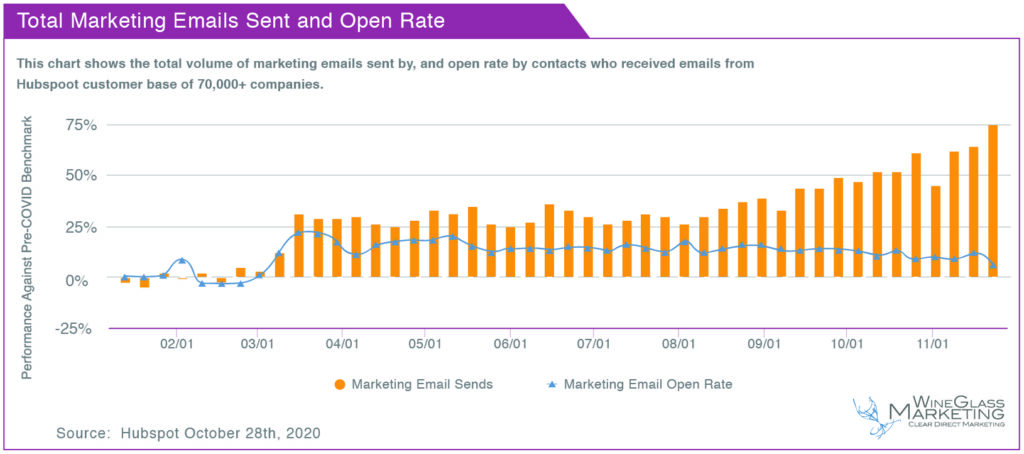
With the outrageous context of 2020 in mind, we widened our scope for this year’s benchmarks and leaned into the data. We pulled statistics for the past year on 222 wineries with over 9,000 campaigns and just shy of 46 million emails, and what we found was interesting.
THE RESULTS
We all increased our email campaigns.
The average number of campaigns sent per winery in our 2018-2019 report was 1.88 per month, equating to a little less than 23 emails a year or a frequency of one email every 2-3 weeks for sales, events, or wine club communications.
The average number of campaigns sent per winery in 2020 is double this at 3.63 per month, which means that on average, we sent one email a week to communicate with our customers this year. It seems that we followed suit with other industries who jumped on email as the logical replacement for in-person customer care, sales, and support. And why not? Email is relatively inexpensive, and it does not require staff to be present in the office or consumers to be in a particular location either. It is, actually, the perfect COVID marketing platform.
However, did these emails work?
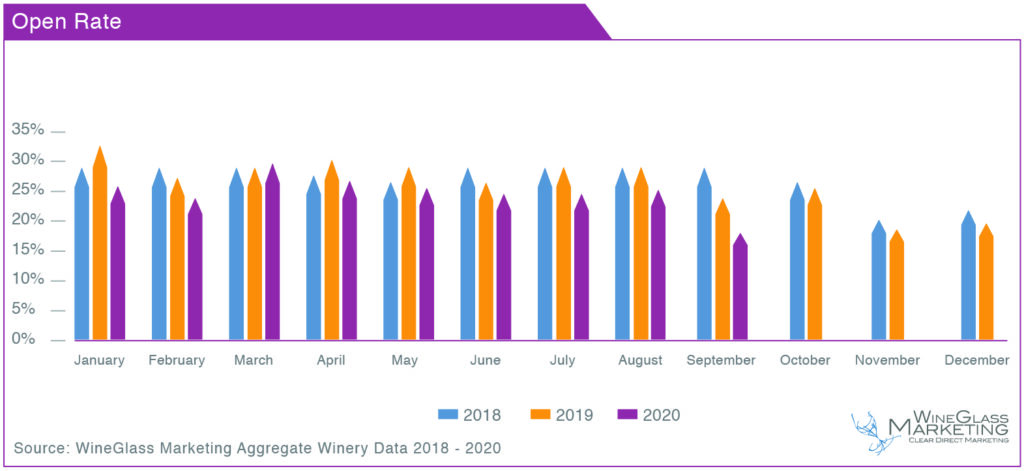
Open Rates Fell
Initially, we look to open rates to gauge if customers are receptive to our messages. An open rate is how many people, expressed as a percentage, opened an email and is largely a factor of three things:
• The sending address or who the email is from.
• The subject line.
• The teaser text that appears in browsers to provide a summary of the email.
However, environmental factors that contend for attention can trump all of these rules. The data exposes that after an initial spike in March during the initial COVID Shelter-In-Place orders, there has been a steady decline in Open Rates in 2020. Moreover, although this study ended on 9/30 – we can also assume we will experience lower rates in November and December with the election and the standard holiday email burnout.
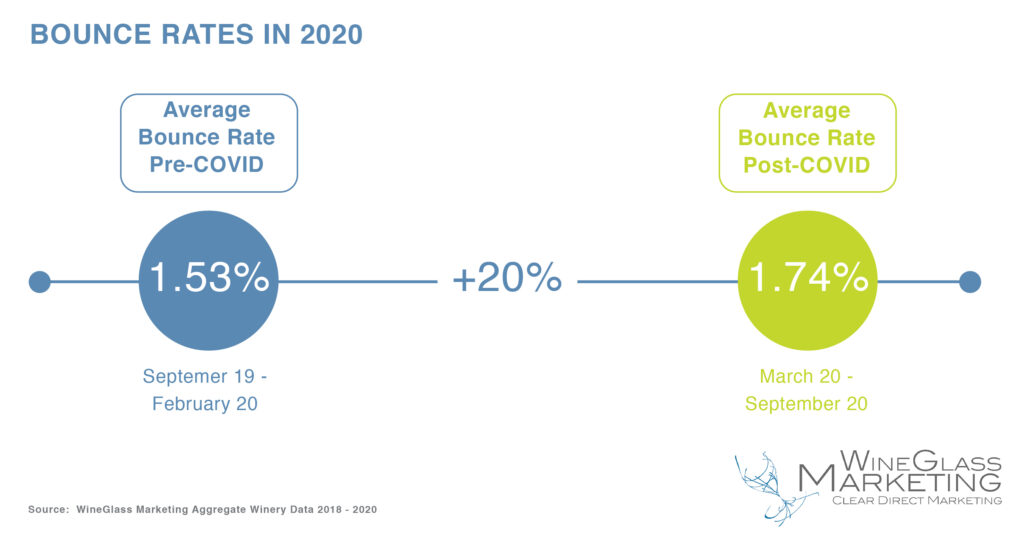
Bounce Rates Increased
Bounces fall into two classes. A soft bounce is when the receiving server recognizes the email recipient, but the address is blocked at the moment: such as an out of the office response. A hard bounce means the address is no longer on the server.
With office closures and unemployment hitting the double digits mid-year, we can confidently assume that many email addresses changed this year.
This hypothesis played out in the data as we saw bounce rates jump by 20% from pre-COVID to post-COVID months.
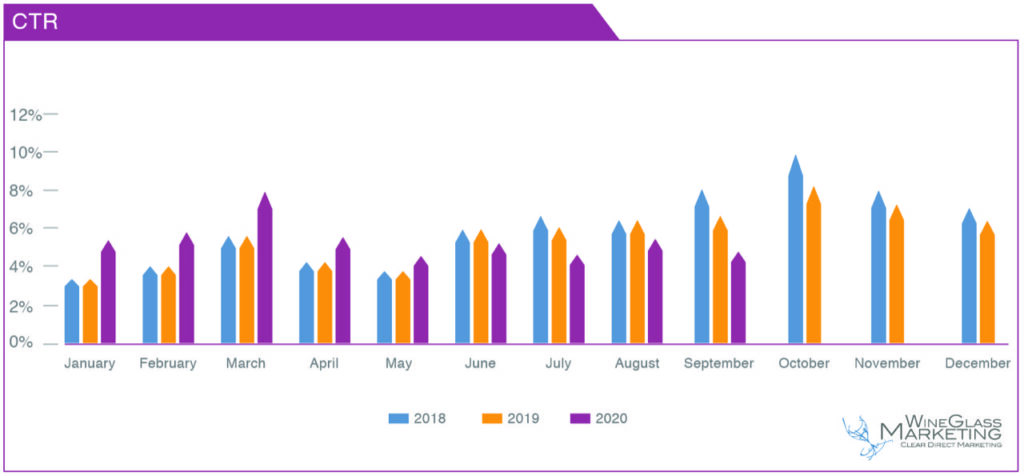
Click-Through Rates Skyrocket
The Click-Through Rate is how many people click on an email, expressed as a percentage, and mostly depends on how compelling the email is. What is considered compelling is mostly subjective but includes the offer itself, the copywriting, and the presentation, such as an image, text, or a button.
The exciting thing about the Click-Through Rate is its independence of other metrics – such as Open Rate or frequency. Click-Through Rates are an accurate indication of a customers’ interest in the message.
The closure of thousands of wineries and restaurants forced customers to look to other channels for their essential wine needs. The most obvious of these channels is emails directing sales to eCommerce. Therefore, consumer attention and consumption of email messages swelled in March and Click-Through Rates stayed very high through Q3. We hope this results in strong eCommerce sales for everyone, and this continues through the holidays.
So after at the end of 2020, businesses appear to be adapting to the new normal. Digital transformation is accelerating. Inbound marketing strategies are working incredibly well, while outbound sales strategies are struggling. Buyers are more in control than they’ve ever been, and companies delivering a great digital customer experience are winning.
Susan DeMatei is the President of WineGlass Marketing, a full-service direct marketing firm working within the wine industry in Napa, California. www.wineglassmarketing.com
Be the first to comment